Examples
Simple example
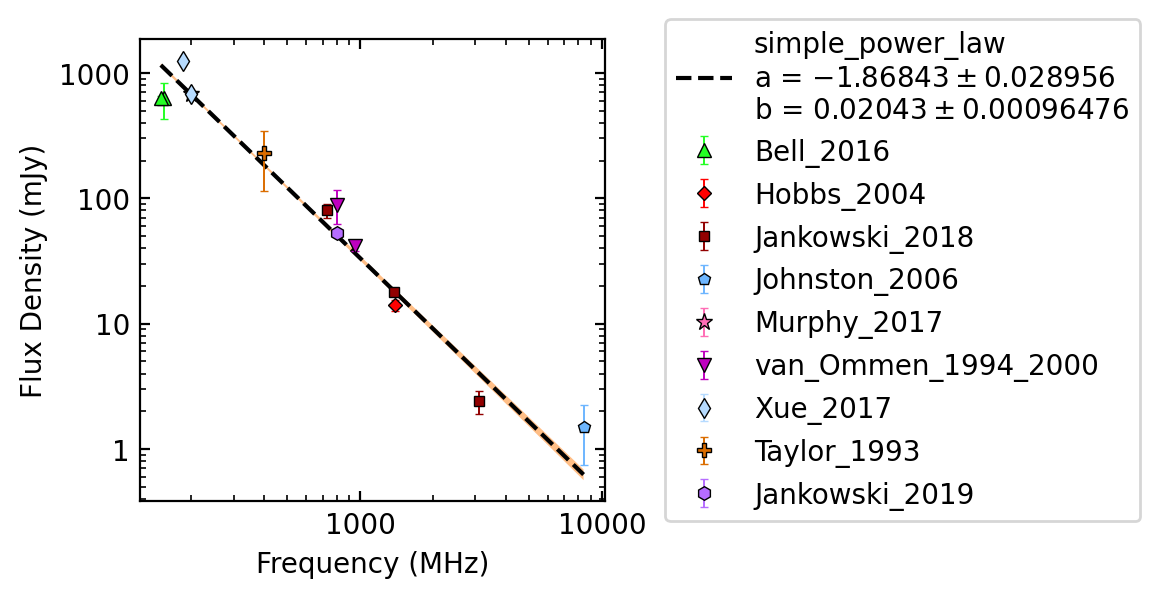
The following can be run to fit J1453-6413
from pulsar_spectra.catalogues import collect_catalogue_fluxes
from pulsar_spectra.spectral_fit import find_best_spectral_fit

cat_list = collect_catalogue_fluxes()
pulsar = 'J1453-6413'
freqs, fluxs, flux_errs, refs = cat_list[pulsar]
find_best_spectral_fit(pulsar, freqs, fluxs, flux_errs, refs, plot_best=True)
This will produce J1453-6413_simple_power_law_fit.png
Adding your data
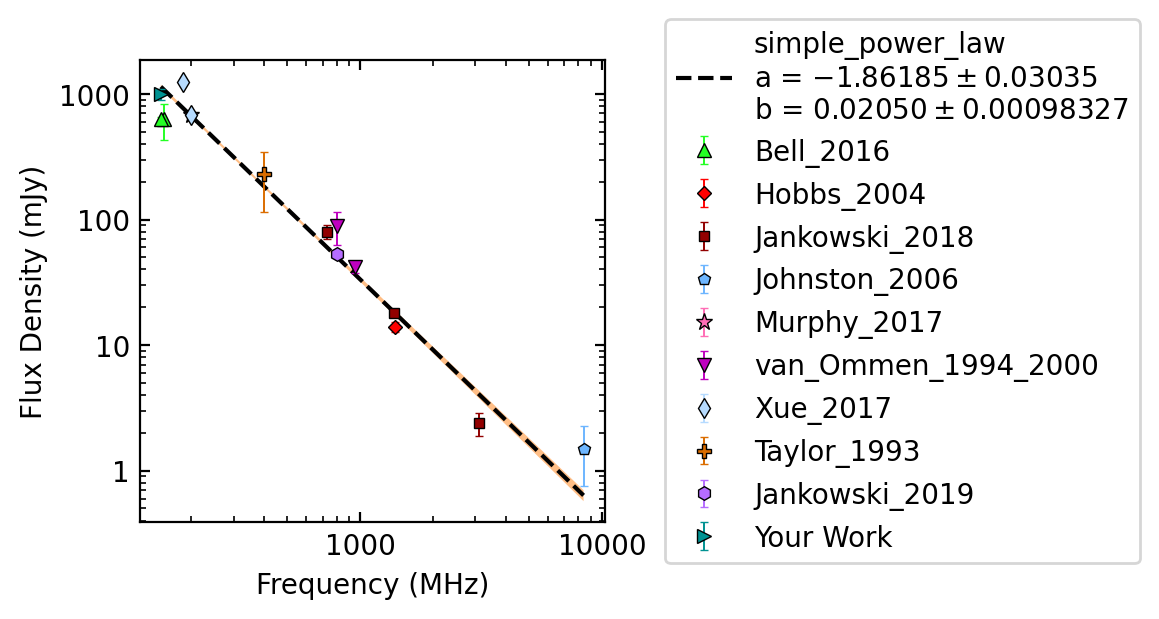
Expanding on the previous example you add your own example like so
from pulsar_spectra.catalogues import collect_catalogue_fluxes
from pulsar_spectra.spectral_fit import find_best_spectral_fit

cat_list = collect_catalogue_fluxes()
pulsar = 'J1453-6413'
freqs, fluxs, flux_errs, refs = cat_list[pulsar]
freqs += [150.]
fluxs += [1000.]
flux_errs += [100.]
refs += ["Your Work"]
find_best_spectral_fit(pulsar, freqs, fluxs, flux_errs, refs, plot_best=True)
This will also produce J1453-6413_simple_power_law_fit.png with your data included in the fit and plot.
Making a multi pulsar plot
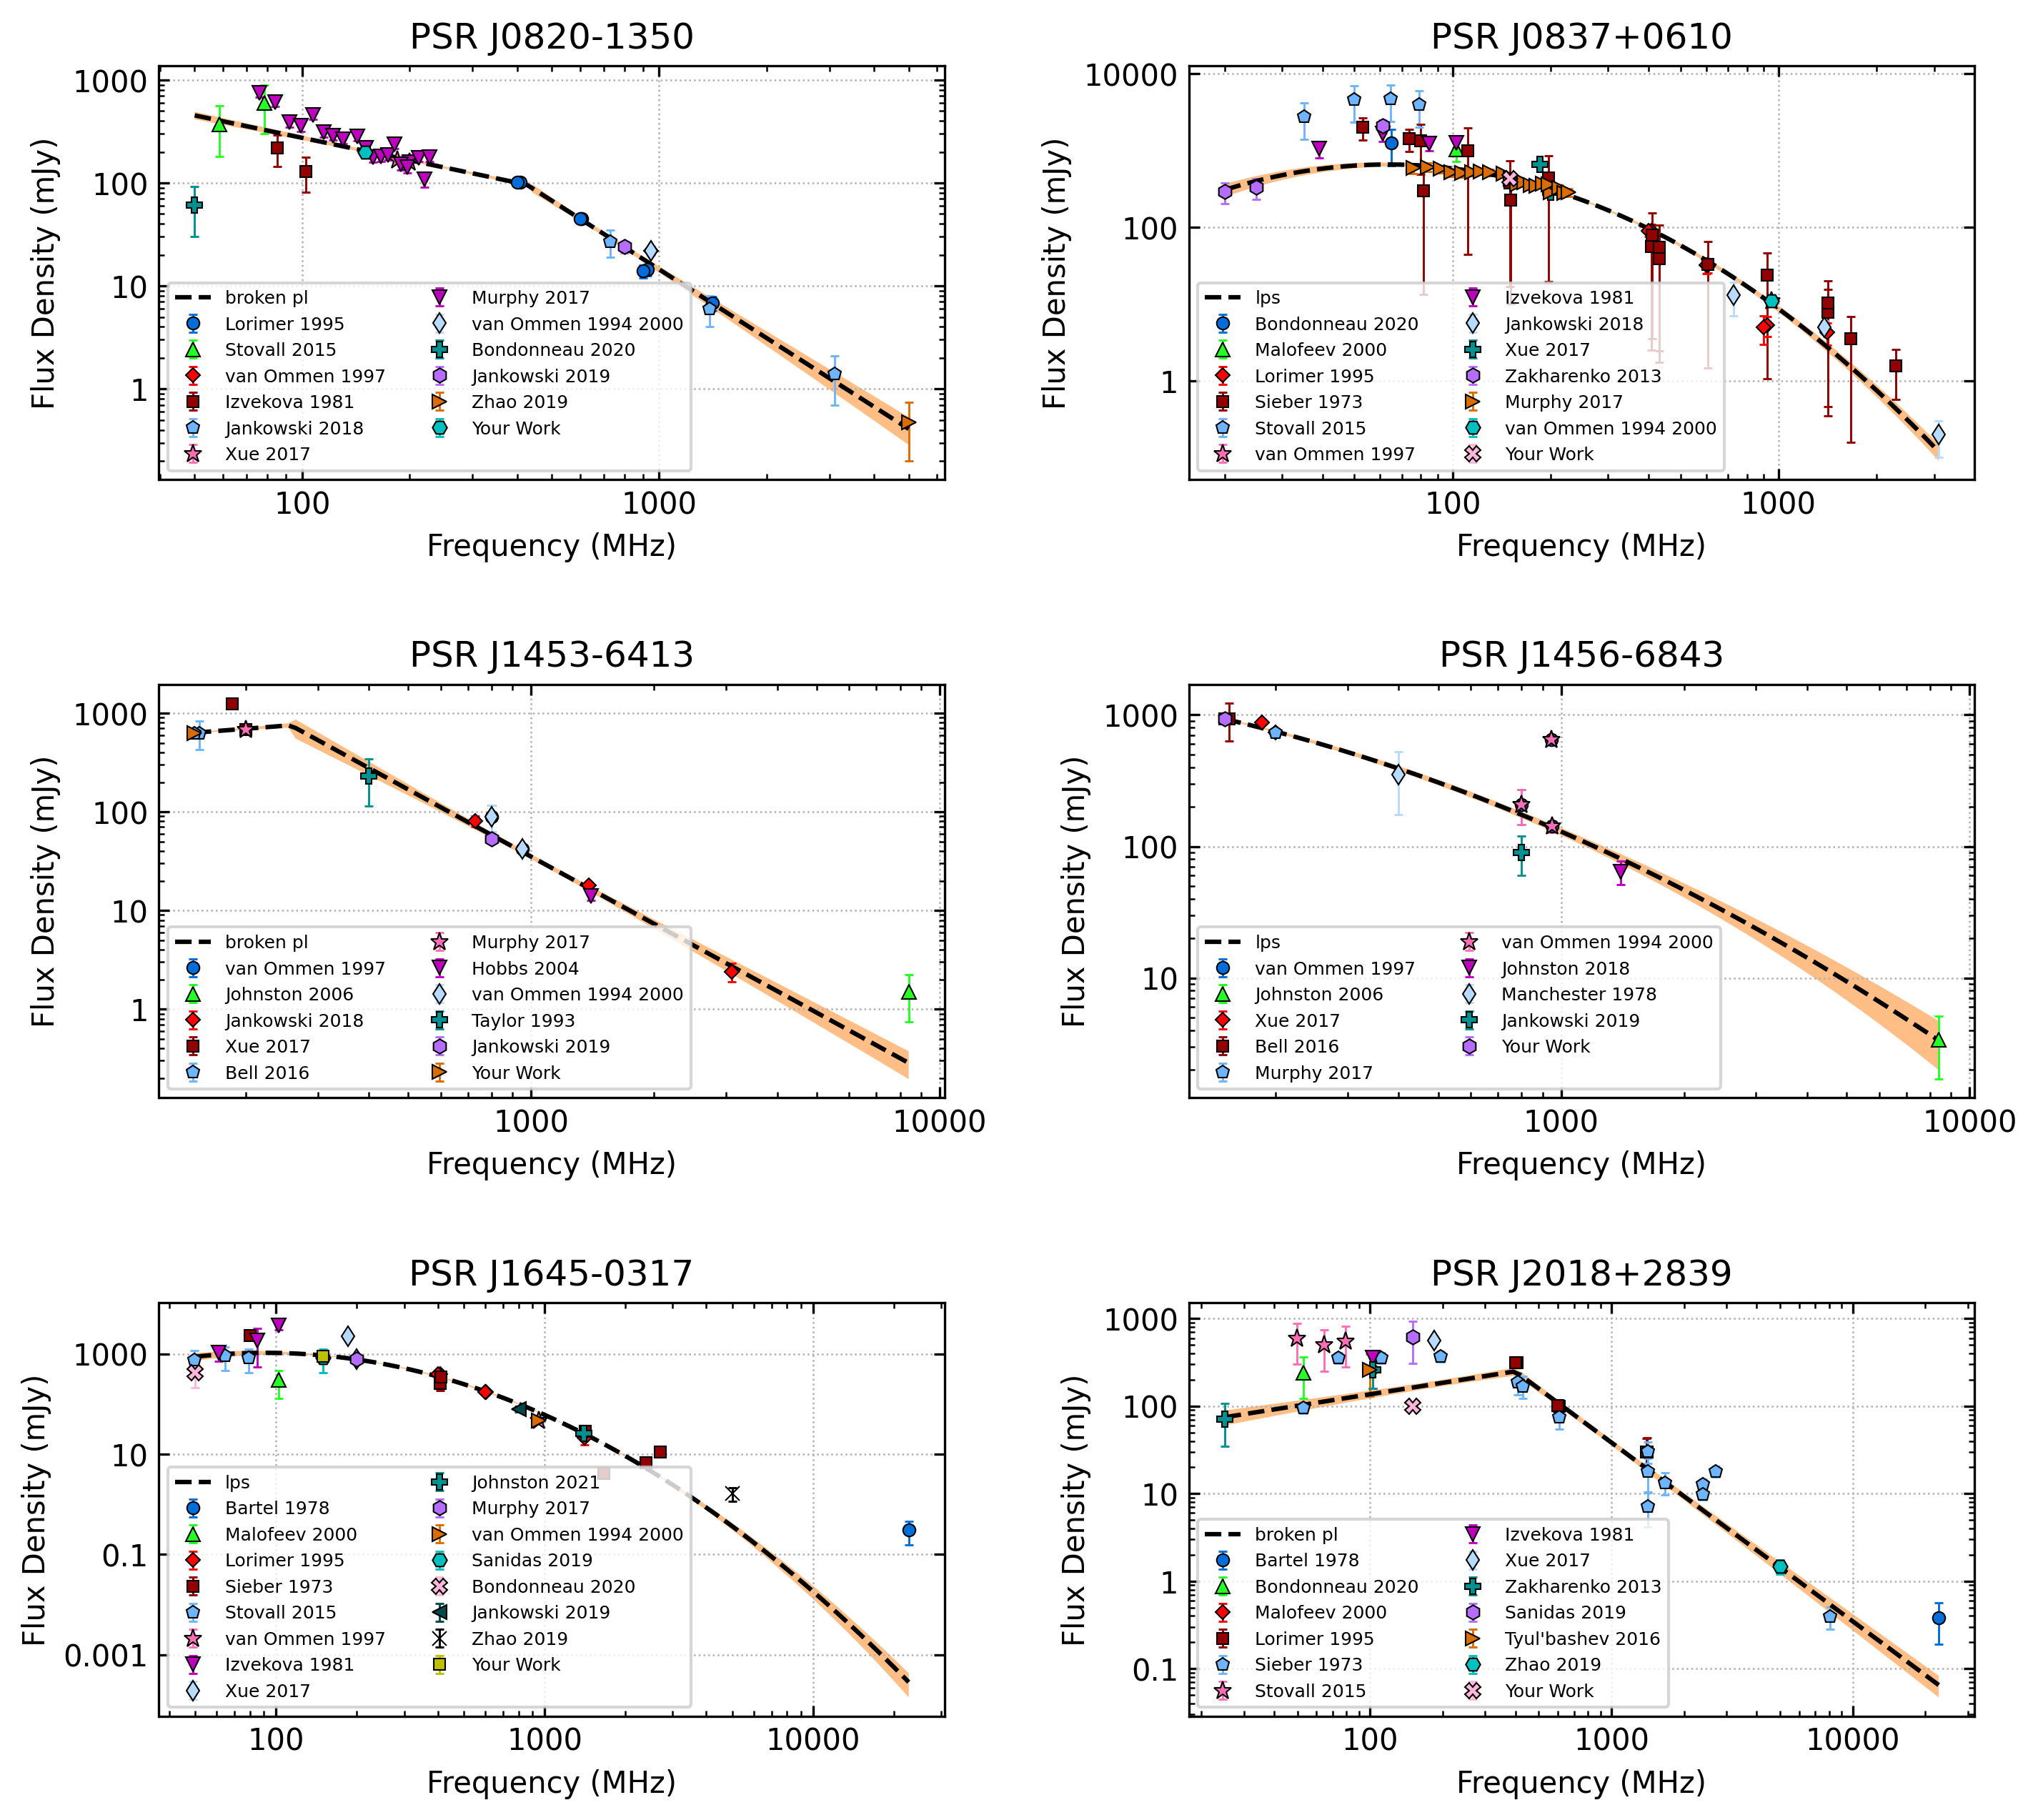
You can create a plot containing multiple pulsars by handing the find_best_spectral_fit a matplotlib axes like so:
import matplotlib.pyplot as plt
from pulsar_spectra.spectral_fit import find_best_spectral_fit
from pulsar_spectra.catalogues import collect_catalogue_fluxes

# Pulsar, flux, flux_err
pulsar_flux = [
    ('J0820-1350', 200, 9,  0),
    ('J0837+0610', 430, 10, 1),
    ('J1453-6413', 630, 20, 2),
    ('J1456-6843', 930, 25, 3),
    ('J1645-0317', 883, 80, 4),
    ('J2018+2839', 100, 10, 5),
]
cols = 2
rows = 3
fig, axs = plt.subplots(nrows=rows, ncols=cols, figsize=(5*cols, 3*rows))

cat_list = collect_catalogue_fluxes()
for pulsar, flux, flux_err, ax_i in pulsar_flux:
    freqs, fluxs, flux_errs, refs = cat_list[pulsar]
    freqs += [150.]
    fluxs += [flux]
    flux_errs += [flux_err]
    refs += ["Your Work"]

    model, m, fit_info, p_best, p_category = find_best_spectral_fit(pulsar, freqs, fluxs, flux_errs, refs, plot_best=True, alternate_style=True, axis=axs[ax_i//cols, ax_i%cols])
    axs[ax_i//cols, ax_i%cols].set_title('PSR '+pulsar)

plt.tight_layout(pad=2.5)
plt.savefig("multi_pulsar_spectra.png", bbox_inches='tight', dpi=300)
This will produce the following plot.
Estimate flux density
You can use the pulsar’s fit to estimate a pulsar’s flux density at a certain frequency like so:
from pulsar_spectra.spectral_fit import find_best_spectral_fit, estimate_flux_density
from pulsar_spectra.catalogues import collect_catalogue_fluxes

cat_list = collect_catalogue_fluxes()
pulsar = 'J0820-1350'
freqs, fluxs, flux_errs, refs = cat_list[pulsar]
model, m, _, _, _ = find_best_spectral_fit(pulsar, freqs, fluxs, flux_errs, refs, plot_best=True)
fitted_flux, fitted_flux_err = estimate_flux_density(150., model[0], m)
print(f"{pulsar} estimated flux: {fitted_flux:.1f} ± {fitted_flux_err:.1f} mJy")
Which will output
J0820-1350 estimated flux: 208.7 ± 8.6 mJy